GPTMap
GPTMap Automatically reservoir mapping software
GPTMap is based on fine reservoir geological studies, can be automatic mapping 2-D plan and profile drawings, also compatible with interactive editing. Meet the need of the geological static and production dynamic maps, providing practical and easy to use drawing tools for the fine geological research and analysis of reservoir.
Main feature:
- Unified data and graphics
The data change, the graph renews, graph change, data updating. As long as the data exists, you can restore the graphics. After adding a new well, as long as the data changes, graphics will automatically update
- Set a variety of drawing functions in one
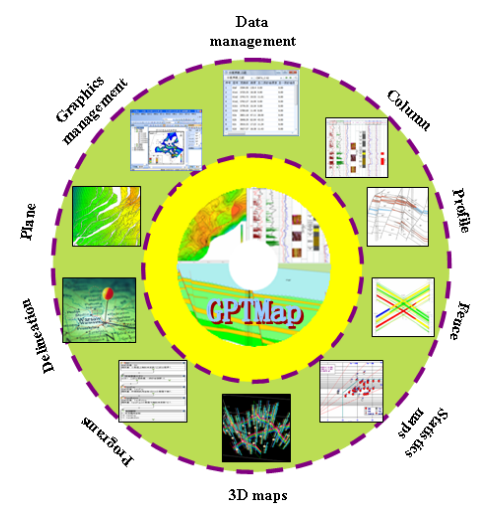
GPTMap connect the planes, sections, columns, fences and charts and other graphics into a software, easy to use, is not available in other software. Automatically track the sedimentary facies belts and fill them
- Generate facies-controlled and arbitrary line-controlled contours
Make full use of sedimentary facies, lithofacies research results, carries on to various attributes contours by phased interpolation
- Horizontal well profile projection display
Generate vertical profile along the horizontal well trajectory, not only reflect the true trajectory of horizontal wells, but also display the log curve, electric log properties, picks and so on, while joint showing the vertical or inclined wells.
- Unify the interpretation process and results
GPTMap is not only a mapping tool but also a research platform; not only focus on the presentation of research results, also support interactive research. You can research the plant heterogeneity, and do the stratigraphic division, correlation, connectivity relations and the other geological research.
- Automatically map and interactive edit
According to the custom-made template to batch map, meanwhile, provide a flexible, easy editing function.
- Unify the static research and the dynamic analysis
Support for oil fields static data and dynamic data management. Production status graphic can satisfy the oil-field development dynamic research
- Theory and practice
Using the fine reservoir description and the lasted computer technology, automatically carry on the geology map. Follow the oil industry database and mapping standards, focus on solving practical problems.
- Provides the personalized demand and extended routine interface
Customize the user-specific data interface and graphics templates, use the graphical programming interface, users do not know how to program can "paint" out the procedures
Rating
Visits
1,644
Redirects
314
Don't Miss Out! Get the Best Deal on this Software - Email Us Now!