Petrel Data Analysis
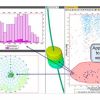
The Petrel Data Analysis module allows interactive analysis of distributions and trends as well as their relationships across all data types. It includes the histogram, function, and stereonet windows—as well as the data analysis process—in which upscaled well data and grid properties can be analyzed.
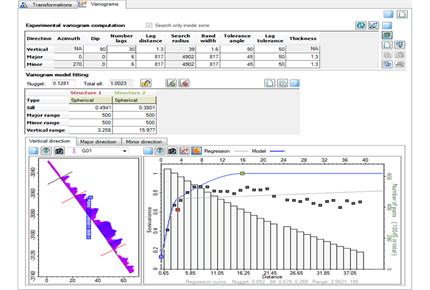
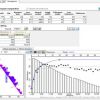
The interactive variogram analysis includes options for initial search-cone parameter suggestions, fitting the variogram to the regression curve, and building a nested variogram. Detailed analysis can be saved for each property for direct use in the modeling processes. Sensitivity plots enable you to compare the impact of each uncertain variable in a risk-analysis context.
Features
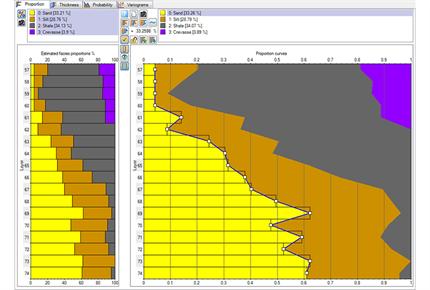
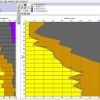
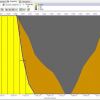
- Import and export vertical proportion curves for specific facies and optionally fit all vertical proportion curves to the histogram for all zones and all facies automatically and all at once
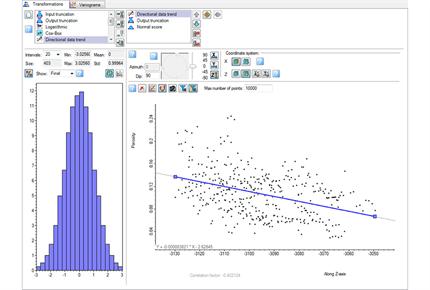
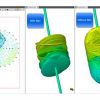
- Prepare input data using transformation sequences (input/output truncations, scale shifts, and distribution shape options complemented by tools for trend fitting and removal) prior to petrophysical modeling
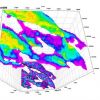
- Generate variogram maps from your input data to determine major and minor directions
- Use the full declustering option for data analysis of horizontal or clustered wells to honor global facies and petrophysical proportions
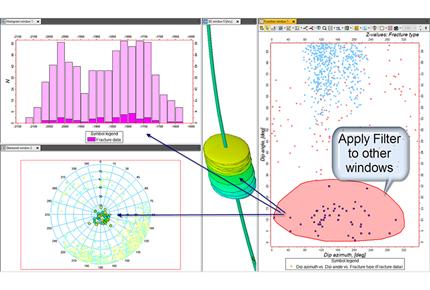
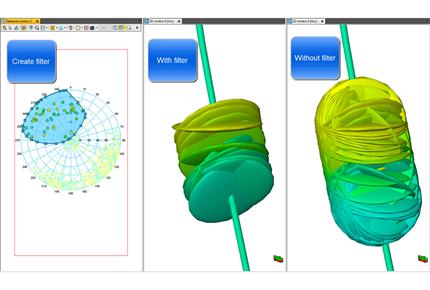
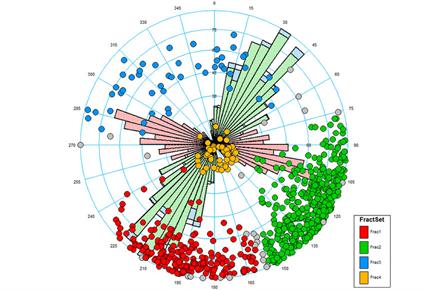
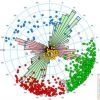
- Display rose diagrams and analyze dip and azimuth data in stereonet windows
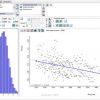
- View simulation summary results using crossplots and histograms in the function window
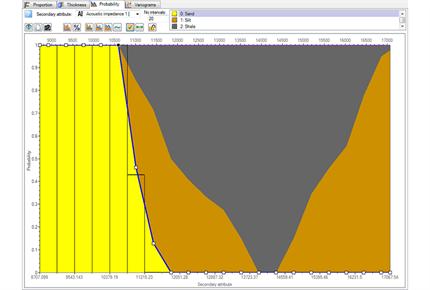
- Create functions from crossplots and create raw crossplots and distribution functions from histograms
Rating
Visits
2,630
Redirects
411
Don't Miss Out! Get the Best Deal on this Software - Email Us Now!