Russian Tools
Calculation using Techlog charts
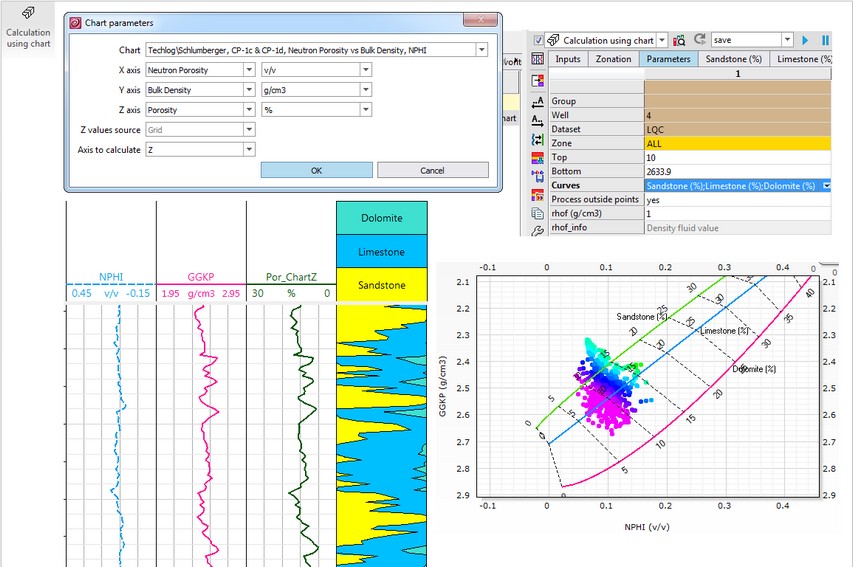
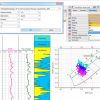
Techlog has numerous charts and they all are used qualitatively only, as a background for cross-plot data. The Charts calculation method enables quantitative analysis and estimation of data with background charts. Each chart has three axis: X, Y and Z. The last one represents by the curve codes or chart grid. Knowing the values of the two axis, this algorithm calculates the value on the third one.
Plug-in Overview
Russian Tools provides a set of solutions for Russian borehole tool data processing and interpretation. The functionalities cover the raw tool data preprocessing, quanti petrophysical calculations and layer-by-layer log interpretation.
Specifications
Hardware requirements
- Windows 7, 8 or 10 Operating System
- 64-bit only (32-bit is not supported)
- Techlog 2016.X or higher
Features
- Raw tool data processing to calculate Spontaneous Potential Alpha, Resistivity from
- Induction tools, Bulk Density and Neutron Porosity
- Fomenko methodic for Porosity calculation
- Automatic zonation based on log analysis (Layering)
- Automatic log averaging using several methods
- Calculation using the Techlog chart library and custom user charts
- Russian borehole tools data preprocessing
- Use classical algorithms of Russian interpretation worflow
- Bed-by-Bed log interpretation approach
- Russian and English user interface
Rating
Visits
2,155
Redirects
345
Don't Miss Out! Get the Best Deal on this Software - Email Us Now!