P2 Explorer
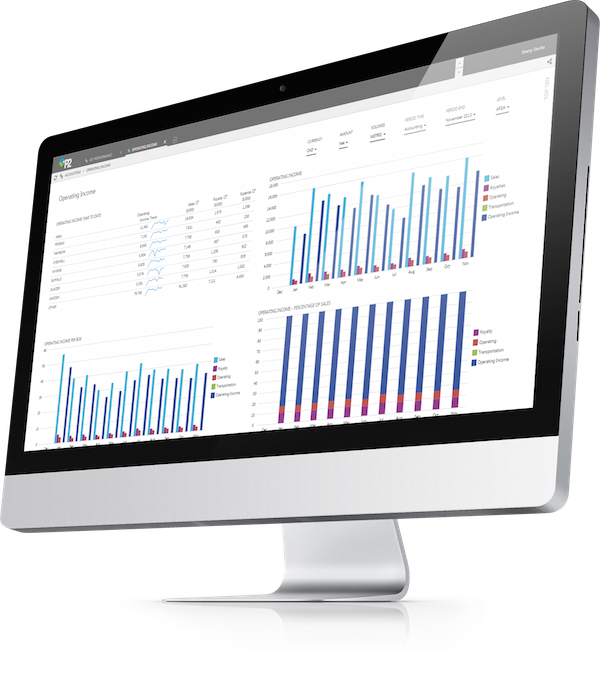


Visualizations and Diagnostics. P2 Explorer provides crucial business KPIs and meaning to your data through easy to consume visualizations and dashboards as well as drill down and diagnostic capabilities. Highlighting exceptions and understanding the root cause of exception provides decision support and focused activity. P2 Explorer enables transparency across your organization with the ability to see back office accounting LOS and AFE data with front office operational and real-time, historian data.
Visualization Types
Diagnostic Displays, Trends, Process Mimics, Deviation Monitoring, Bubble Maps, P2 Shapes, Maps, Charting, KPI Dashboards, and Plant Reference Models are some of the visualization types possible with P2 Explorer.
Oil & Gas Dashboards
P2 provides preconfigured dashboards, specific to the upstream oil and gas operator, to enable immediate value with very low implementation and configuration requirements. At the same time, the solution provides easy configuration of new pages and trends that allows users to quickly create asset or operation specific dashboards.
Enhance & Analyze Data with Real-Time Calculations
The P2 Server Calculation Engine provides advanced functionality to calculate and evaluate existing data derived from any of the P2 Server data sources. This allows for complex, time-based analysis of production data with ERP, Financial, Maintenance, or any other data source, making it possible to perform in-depth analysis of results such as performance and reliability KPIs. Statistical processing (averages, standard deviation, integral, etc.) of current, previous, and variance values for source data (such as tag values) can be used for performance evaluation and monitoring.
Rating
Visits
1,651
Redirects
358
Don't Miss Out! Get the Best Deal on this Software - Email Us Now!