SurfNet
Overview
Accurate prediction of asset deliverability often requires modeling of the reservoirs, wells, and surface facilities as a single integrated system. This enables the engineer to assess total asset deliverability from the reservoir through point of sale. Nexus® simulation software enables the workflow that tightly couples the reservoir to the surface facility, allowing the engineer to model the entire asset accurately.
Using SurfNetTM post-processor software, the engineer can visualize and analyze the production and injection systems of one or an entire group of reservoirs at whatever level of detail desired, including perforations, wellbore equipment, and the detailed surface facility model. Even for complex assets, the engineer can track flow paths and obtain an overall picture of the entire network at any point in time.
Features
Network Canvas
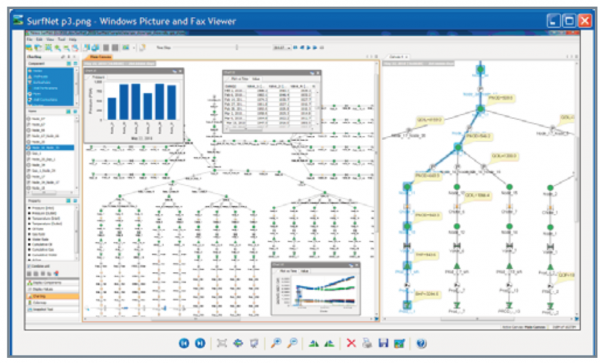
The network canvas is the main display window for SurfNet software. The network schematic, along with requested properties for the network components, is displayed on the canvas. The user has access to all network data within the canvas, such as pressures and flow rates and their evolution in time, and can display the data either in numeric form or in charts. Critical sections of large networks can be selected and moved to a new canvas for detailed evaluation, and deactivated network sections can be eliminated from the canvas. The pictorial representation of the network allows the user to determine quickly and easily whether the network corresponds to its design.
Data Display
Within the canvas, the user can display simulated network properties as a function of time. Different options for this display allow the user to highlight specific aspects of the data. Flow rates and pressures can be displayed directly on the network using a colormap or in text adjacent to the network component. Data for an individual connection or node can be displayed as a function of time in charts that float above or can be docked to the canvas. Differing display modes provide a variety of approaches for studying the data, ensuring that unusual or unexpected behavior can be spotted and studied thoroughly.
Snapshot Tool
After the data of interest is displayed on the canvas, the Snapshot Tool allows the user to capture the canvas or associated plots to include in reports or other documents. Multiple snapshots can be created and then saved in standard display formats for presentation.
Rating
Visits
1,194
Redirects
257
Don't Miss Out! Get the Best Deal on this Software - Email Us Now!