IVM Visualisation
What is IVM?
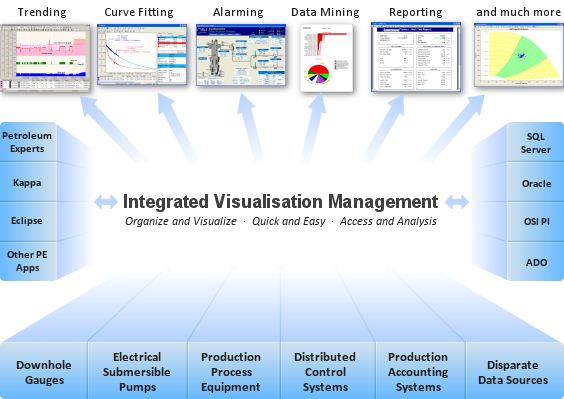
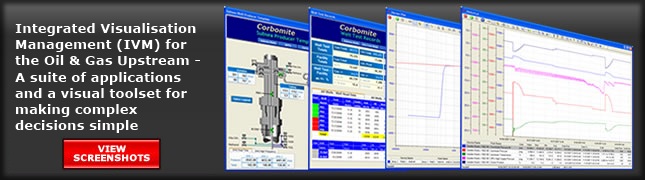
Integrated Visualisation Management (IVM) is a software solution that bridges the gap between data sources and sophisticated Petroleum Engineering analytical & modeling tools to provide engineers, operators and management a way to organize and visualize the data and trends. Often, with IVM's analytical capabilities such as advanced trending, XY plots and Horner plots, decisions can be made and actions can be taken quickly without the need for further analysis. If further analysis with more sophisticated modeling tools is needed, IVM provides an easy graphical ability to select and condition the data and export it into other modeling tools.
Collaborative Forum
IVM provides the missing connectivity between real time control systems, data historians, and production accounting systems, so personnel have timely information at their fingertips via various mobile devices.
The connectivity provided by IVM brings together geographically distributed facility, production, reservoir, and management personnel by providing a common, easy-to-use virtual forum to collaborate and work together. IVM delivers real-time information and the tools that accelerate quick interactions between these separate disciplines.
Built-in Applications
Additionally, IVM has several built- applications that can be used as stand alone pieces.
- Trend Curve Analysis
- Automated Well Testing
- Remote Well Operations
Rating
Visits
1,413
Redirects
328
Don't Miss Out! Get the Best Deal on this Software - Email Us Now!