GEONAFT-Well Correlation Module
WELL CORRELATION MODULE
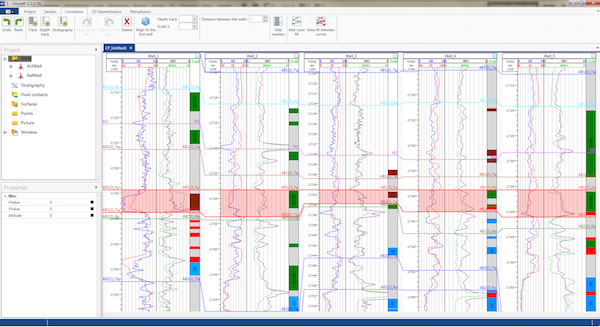
Module allows performing interwell correlation for more precise identification of geological markers, optimal candidates selection for a role of evaluation well, rapid identification of intersections with key formations. Correlation panel data is updated in real-time mode when new data comes in, and the results of interpretation may be used in other modules of “Geonaft” software package.
Log View
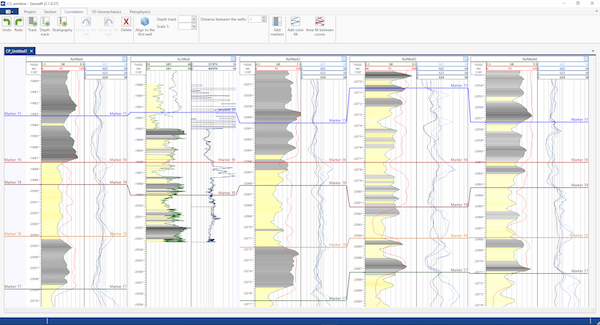
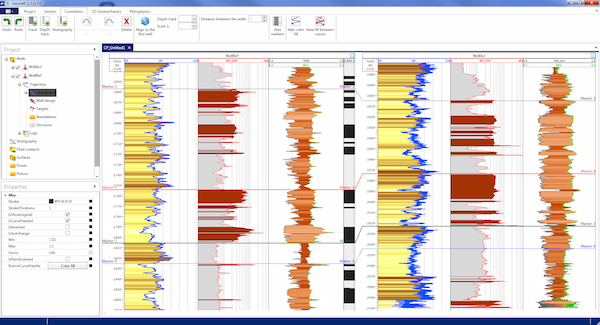
Correlation panel allows displaying a large quantity of types of information on vertical tracks. In addition to logging curves, images, descrete measurements and discrete curves, geological zones and markers specified by the user, as well as any predicted curves are also displayed. All the information in the panel is updated in real-time mode every time new data comes in.
Panel allows performing interpretation using the discrete curves mechanism. Any changes introduced in the module are automatically reflected in other modules of the software package.
Graphic elements of the tablet are updated automatically when new data comes in or during editing of the previously loaded data.
Geological markers
Logging tracks of graphic tablet may be leveled according to the selected marker. MD, TVD or TVDSS may be selected as reference depth points.
Petrophysical calculations
Correlation panel may reflect not only the data loaded by the user externally, but also the predicted curves. User curves may be created by the user with the help of in-built petrophysical calculator.
In addition to the calculator, the module functionality involves such standard data processing functions as smoothing, removing the peaks, etc.


