Petrel Well Correlation Popular
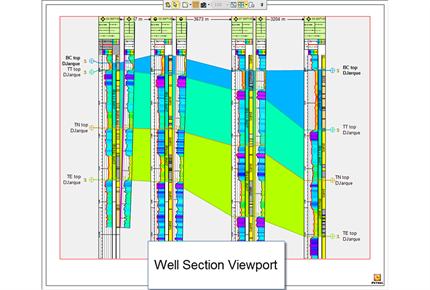
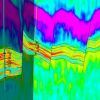
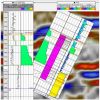
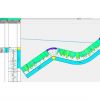
The Petrel Well Correlation module provides a clean correlation canvas on which to display logs, core images, seismic data, grid data, and even completions and simulation results—which can be played through time. Deviated wells can be displayed overlain on seismic or 3D grid properties.
You can interactively create and share cross sections across projects; the cross sections can be directly edited in the 2D or map window. Tools for picking markers, for estimating logs by trained neural networks, and for interactive log conditioning enable a robust stratigraphic interpretation. Visualization performance is such that thousands of wells can be handled simultaneously.
Features
- Interpret discrete properties interactively
- Pick and edit well tops on the cross section and see the effects directly in 3D and vice versa
- Edit existing logs or generate new ones from any number of curves using the powerful well log calculator, the log editor, or the interactive log conditioning toolbar
- Generate ghost curve for multiple logs simultaneously with stretch and squeeze tools and automatic drop of markers
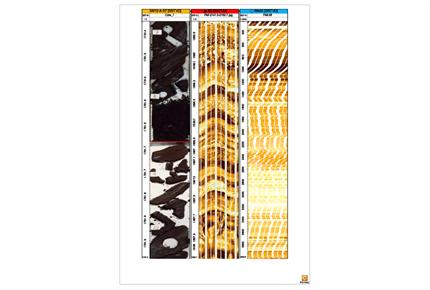
- Display logs, core images, point data, image interpretations (rose diagrams and tadpoles) from the FMI fullbore formation microimager, checkshots, and synthetic seismograms
- Backdrop seismic data, generic surfaces, 3D grid geometry, 3D grid properties with optional transparency, completions, and simulation results with an associated dynamic time player
- Visualize and interpret on deviated wells in the cross section
Listing Details
Visits
4,269
Redirects
627
Don't Miss Out! Get the Best Deal on this Software - Email Us Now!
Map
© OpenStreetMap contributors


