Trinity T3
3D Migration
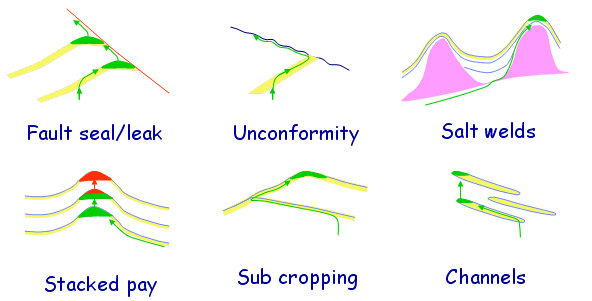
T3 has many additional features on top of the standard Trinity version. The largest leap in T3 is to allow tracking of hydrocarbon fluid volumes and properties while they migration in 3D space. Interactive 3D migration allows petroleum system analysist to de-risk migration scenarios for proepects.The following figure shows the ability of T3 to model various geological scenarios where migration occurs vertically.
Temperature And Allocthonous Salt
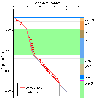
Another important feature of T3 is its ability to correct for the conductivity effects of allocthonous salt through time. This feature improves the ability to model sub salt source rock thermal history and maturation. The figure below shows a temperature profile at a well location in T3, where the Trinity temperature (blue line) agrees with temperature data and Temis3D model results.
Interactive Biodegradation Tool
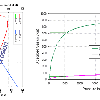
T3 includes an interactive fluid property/ biodegradation risking tool. The instantaneous fluid properties are calculated as a function of source facies and maturity in the fetch area. The fluids are mixed in the reservoir with existing fluids from earlier charge that may be biodegraded. The biodegradation model, considers trap OWC area, column height, nutrient supply, temperature and residence time. User can interactively investigate the possibility of biodegradation and provide best estimate of API gravity for a prospect. Migration losses and migration delay time also will affect the property of the charging oil.
In the figure above, the arrows indicate the time when oil charge begins and time when a competent seal is formed. The arriving oil at present day is 40 API but as 60 percent of the cumulative oil has been biodegraded, the oil in the reservoir now stands at 20 API.
If the reservoir temperatuers are high and biodegradation is not a risk. This tool can be used to look at instantaneous and cumulative fluid API of the oil charge and trap timing effects on oil API.
Shale Gas and Coal Bed Methane Tools
T3 models the burial and thermal history to predict sorption gas, solution and free gas yields (scf/ton or scf/section) over the area. All three phases of gas are pvt and mass balanced through the burial and uplift history of the basin to enable regional evaluation and predict sweet spots. The model is calibrated with well data from a significant shale gas domain. Highly interactive and allows scenario testing with different thermal regime and erosion amounts.
The shale gas tool makes CBM Methane yield maps as function of maturity, thickness, TOC and pressure, temperature. Built-in empirical permeability model. Produces gas yield, permeability maps for sweet spot mapping.
Complex Geology
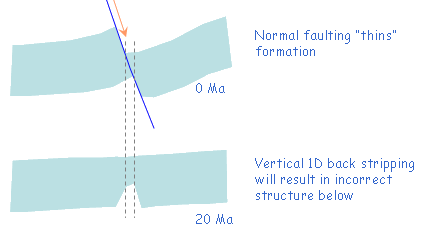
T3 allows thickness change to be applied to multiple layers and multiple events. This allows burial history of v


