4DGeoStress
PSI's stress from interpreted reflection seismic, 4DGeoStress (Pat. Pend.), has taken eight years to develop and is now available for sale.
The purchaser enters a new world of stress consistent seismic interpretation in which you can continually stress test your interpretaion of the structural history displayed on your interpreted seismic which is converted into quantified stress. You can compare the result with today's measured stress direction, if available. 4DGeoStress also generates the stress magnitude which is rarely available except for well monitored earthquakes.
While it is useful to be able to compare your stress maps with expensive wellbore breakout, drilling induced fractures and mini-fracs, the latter are not required, just good quality 2 or 3D seismic.
The primary output is a 3D stress volume derived entirely from a 2D or 3D interpreted reflection seismic dataset. The number of picked horizons, data quality and density determine the accuracy of the quantified values in the 3D stress volume.
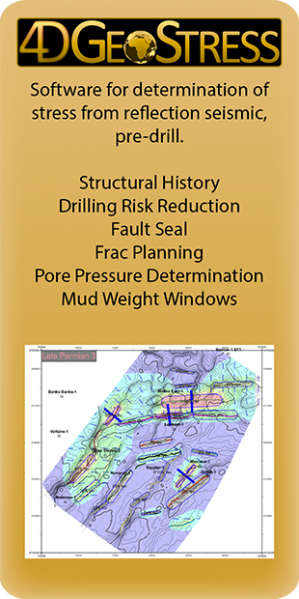
An example of a stress-isochore map derived from 2D interpreted seismic reflection data is shown opposite. The line spacing is large at 2.5 to 5km but good enough to clearly identify a 90° change in SHD. Reducing the line spacing to a few hundred metres from a 3D survey will add detail to SHD and SHM.
The principal stresses SHmax, Shmin and SV (load) are presented with their direction (SHD, ShD and SV ) and magnitude SH/SV concurrently with Sh/SV which express the three Anderson, plus the four PSI extended stress states, as ratios and quantitatively in mega pascals (MPa) with depth.
These 3D data allow multidirectional, arbitrary stratigraphic and stress sections to be generated from the 3D stress volume.
The stratigraphy is also plotted with depth on pressure-depth graphs, plus SHD, for vertical or inclined wells of any orientation. TVDSS or MDSS can be plotted linearly.


