Ignition
InsightEarth Ignition is the data and visualization management tool of the InsightEarth suite of interpretation software. It provides data management, including data I/O, data transfer, workflow definition, workflow and process control and interaction modes. Many tasks are available to the interpreter via simple right-clicks, which means that there is no need to hunt through menus to find an easy solution.
Leverage advanced technology for 3D seismic interpretation
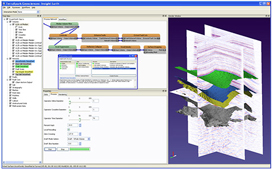
Insight Earth Ignition User InterfaceWhen working with 3D seismic data, being constrained by a 2D interface in an interpretation package might feel like working with printed seismic lines from years ago. There is a better way, which brings working with 3D surveys into the present: InsightEarth Ignition.
InsightEarth Ignition provides viewers and the processing platform for the full range of InsightEarth interpretation workflows. It enables geoscientists to condition seismic data for subsequent processing and optimize volumes for interpretation. Manual interpretation of horizons and faults become far easier and more accurate when made using Ignition's customizable tools.
Multiple 3D viewers may be created and synchronized, with some viewers displaying data in the structural domain (x, y, z or t) and some presenting data in the stratal domain (x,y, or stratal slice). Up to four volumes of seismic data or attributes can be co-rendered, and these volumes may have their lighting controlled by a fifth independent volume.
Multiple slices (several inlines, crosslines, or time/depth slices) can be displayed simultaneously within these 3D viewers, and InsightEarth has improved the standard arbitrary line into a freehand drawing tool by adding the ability to draw curved volume slices. These Curtain Slices can be used for interpretation and display, and can be saved and restored for use in future interpretation sessions.
3D Visualization
3D interpreted channel restored to current timeInsightEarth is built around a powerful, full-featured 3D visualization system. All data display, interpretation and analysis activities benefit from a very rich set of tools. With 3D available at all times, interpreters naturally think and work in a spatial context instead of traditional planar section/slice views of their data.
Powerful analytic capabilities such as transparency, co-rendering and optical stacking make it easier to locate and qualify anomalies and understand complex geometrical relationships.


