Igpet - igneous petrology
Igpet provides tools for teaching and research in Igneous Petrology, allowing users to develop their own data files and to use graphics routines to discover and interpret patterns of geochemical variation.
- Harker, Fenner, Discrimination, CMAS, SPIDER, REE and Pearce element ratio plots
- Linear regression, hyperbolic mixing and AFC modeling
- CIPW norms and least-squares fractionation and magma mixing calculations
- Transfer data to spreadsheets or graphics to draw programs using the clipboard
- Publication quality output
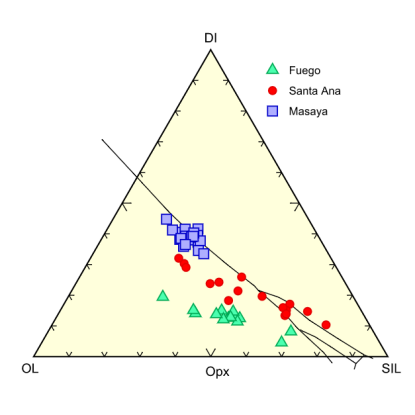
Igpet draws most types of petrologic diagrams, including Harker, Fenner, triangular and log plots. A calculator includes (+ - / *), Log, square, square root, ppm and chondrite functions. Special purpose diagrams, e.g. the Irvine and Baragar (1971) rock classification scheme, are stored in control files that can be expanded easily. CMAS projections include O’Hara, Walker, Grove, Baker and Eggler etc. Spider diagrams include REES, Wood, Thompson, Sun and McDonough etc.).
Igpet comes with several data sets, including low pressure cotectic data, moderate pressure cotectic data, MORB glasses, and several suites of calc-alkaline rocks from Central American volcanoes.


