INPEFA®


INPEFA® plug-in for Petrel* allows you to:
- Enhance well interpretation methods within the Petrel* environment.
- Use familiar workflows– INPEFA® is fully integrated with Petrel* functionality and workflows.
- Limit costs – No investment required to buy and learn a new software package.
- Obtain results quickly – INPEFA® can be applied to any type of well log and logs of different resolution, in just a few simple clicks.
- Limit bias – INPEFA® calculation is data-driven thus unbiased when compared to model driven interpretation.
Product overview
- Enhance well interpretation methods within the Petrel* environment
- Fully integrated with Petrel functionality and workflows
- Obtain results quickly – can be applied to any type of well log and logs of different resolution, in just a few simple clicks.
- Limit bias – calculation is data-driven thus unbiased when compared to model driven interpretation.
Product description
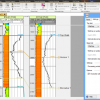
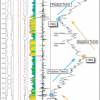
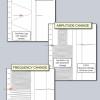
INPEFA® is an acronym of INtegrated Prediction Error Filter Analysis. This analysis method is applied to facies sensitive well logs. The resulting INPEFA curves show discontinuities in the log data, which in terms of geology can be interpreted as hiatuses, erosional surfaces, and changes in lithology and/or sedimentation rate. Since these geological phenomena may occur on a field or even regional scale, INPEFA curves are extremely helpful in well correlations.
Here we explain how INPEFA works and how INPEFA curves can be used for high-resolution and -quality well correlation.
Well logs as (depth-) time-series
A well log consists of a series of measurements of a certain property, normally taken at regularly spaced depth intervals along a wellbore. Because of this regular spacing, the log can be treated as a (depth-) time-series from a mathematical point of view.
Prediction Error Filter Analysis (PEFA)
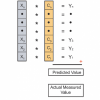
Linear prediction methods can be applied to (depth-) time-series of any well log. The figure below illustrates how we apply linear prediction to well data.
The following steps are taken:
- The length of a sliding window is defined. This length determines the amount (‘n’) of log measurements (‘X’, grey squares) that are included in the calculations. The amount of linear filter coefficients (‘C’, orange squares) also equals ‘n’.
- All or a part of a well log may be selected to be used in the PEFA calculation. The value of the linear prediction filter coefficients (C) are optimized to yield the smallest error (see next steps 3-5) within the selected depth interval.
- Each log measurement is weighted by multiplying its value with a corresponding linear prediction filter coefficient. This cont
RatingVisits2,914Redirects641Don't Miss Out! Get the Best Deal on this Software - Email Us Now!