PDPlot
PDPlot is an easy to use application developed for Petroleum Reservoir Pressure versus Depth Plotting and Analysis.
Though the use of PDPlot you will ultimately :
- Save a significant amount of time and shift the emphasis from preparation and presentation time to interpretation time,
- Achieve better pressure versus depth analyses, and
- Deliver presentation quality plots and graphics quickly
This application was developed to replace the numerous spreadsheet attempts that do the same task, but at the same time include all the various Reservoir Fluid (gas, oil and water) calculations of density to cross plot against the implicit fluid density plotted on a Pressure versus Depth chart.
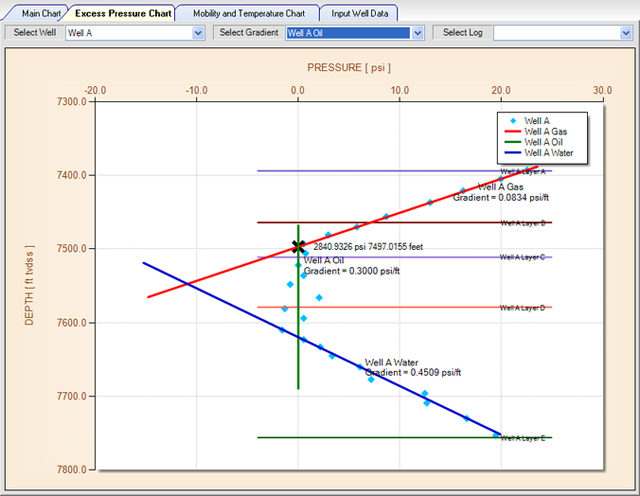
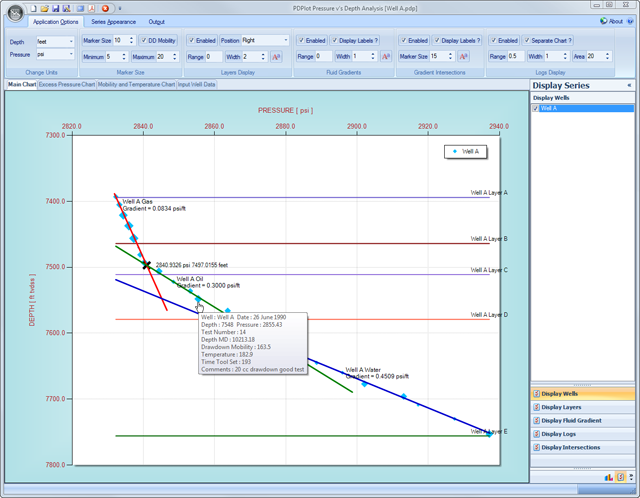
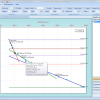
The user can also display single and multiple wells very easily, together with reservoir layer interval information and log displays, all on the same chart as the pressure v's depth data, together with explicit density gradients or regressed fluid gradients.
Easily Input Data
Throughout the application, the user can choose to input data manually, or via an ASCII import facility, or by standard Windows copy and paste or drag and drop functionality. Therefore the user should not have to re-type any values into PDPlot if the data is available digitally from another source, ie. Microsoft Excel.
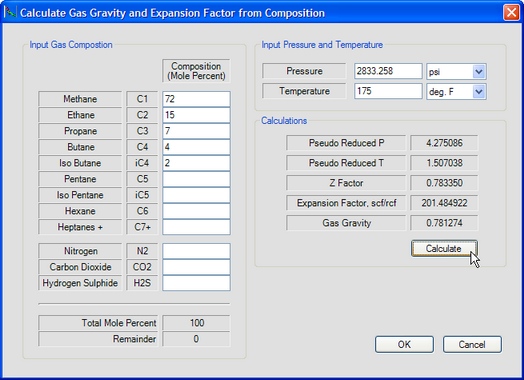
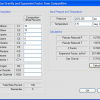
Fluid Gradient Calculations
Fluid gradient or density calculations are input into the application via two different methods. The first method explicitly calculates fluid density with the knowledge of other fluid properties. The second method is a simple linear regression through selected chart data points.