FOCUSRE
Tired of complex tools with thousand of clicks to get a key number?
The first tool to crack analytics for Reservoir simulation results while maximising the productivity of reservoir engineers. Get immediately into the key numbers that really matter to take your decision. Designed to be your daily preferred tool by Reservoir Engineers.
Functionalities:
Ranking view
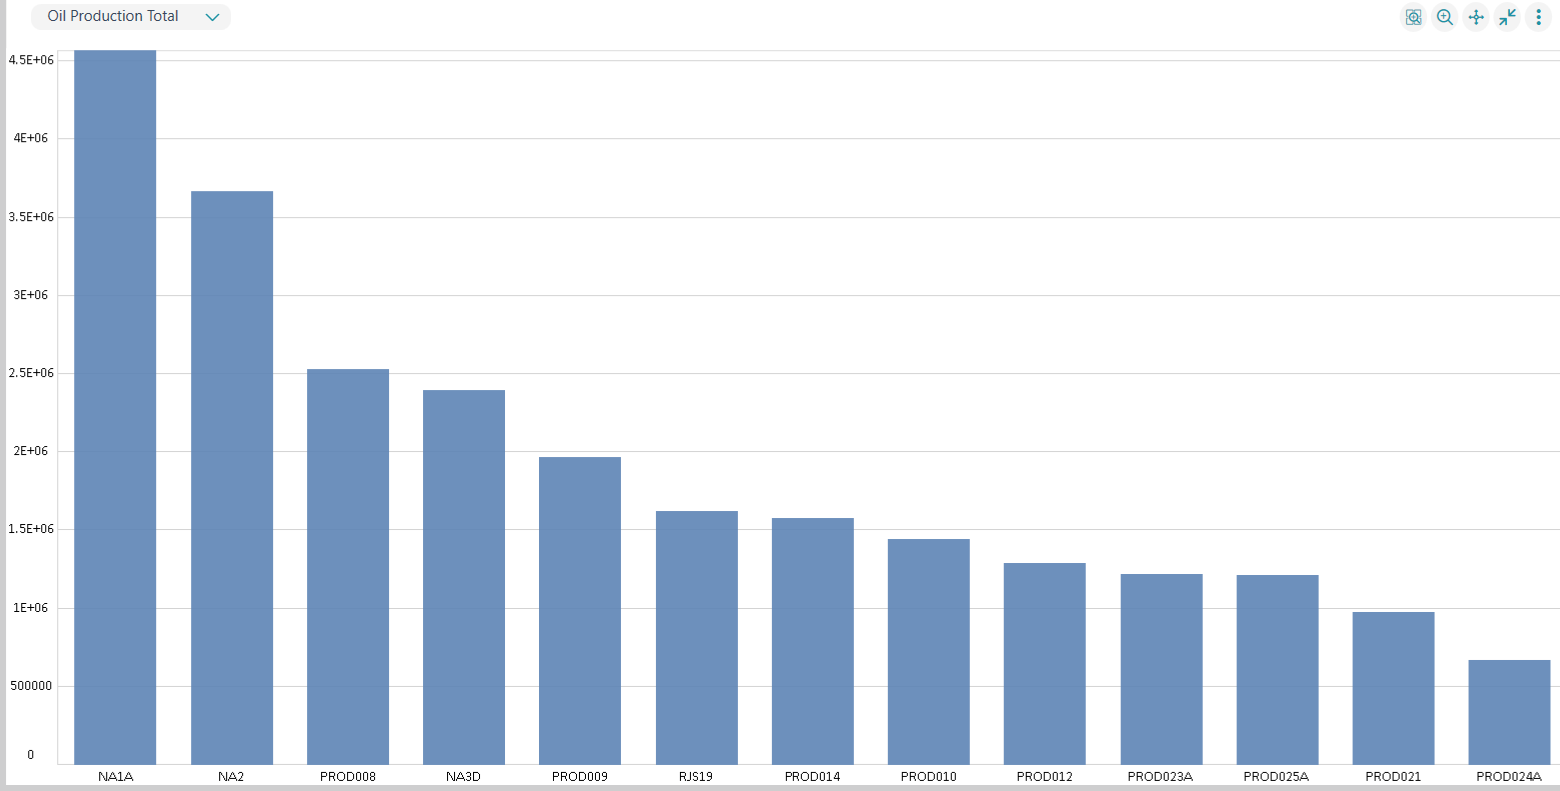
Identify the highest producers or injectors at a particular date/time. Locate the highest water cut producer and double click on his bar to plot its performance.
Interactive Well Selection
Select interactively a group of wells from the map window using the pencil option. With this functionality you can select your wells for analysis based on their real location in the reservoir instead of from a flat list.
Report Ready
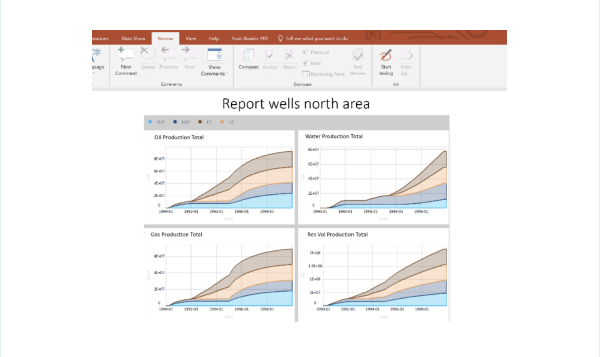
Once analysis is done, reporting your findings and selling your points is a must, with this functionality export you key info into power point and excel ready for your presentation.
Stack Contribution Plots
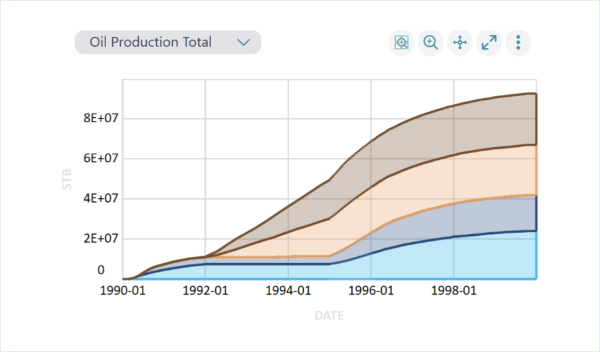
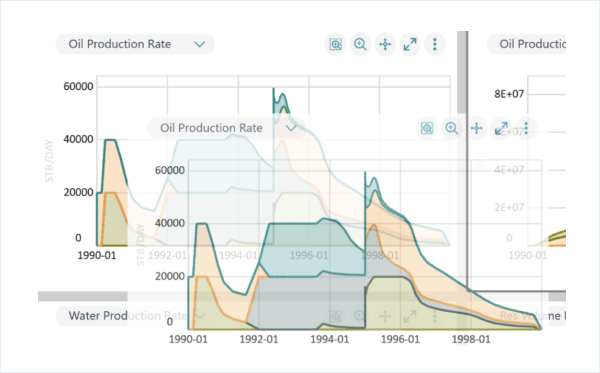
Total Volumes are key limits to monitor but understing individual contributions is even more important for planning and optimization. With this plot we can identify the highest or lowest contributor to total volumes at connection, completion , well or group level.
Drilldown from Field to Connection
Plot the field performance, double click on the field line and its groups will be plotted, double click on a group line and its wells will be plotted, double click on a well line and its connections will be plotted.
Drag and Drop Layout
Need to redefine your plotting layout? Forget to open a settings window, this is from the past. Simply drag and drop the plot into your desired location. Keep simple things simple.
Highlighting the outlier
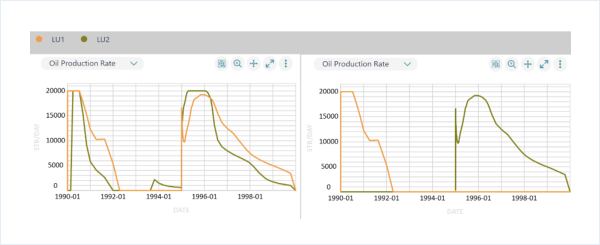
Do you need to identify the outlier well and its location? Just hover the mouse on the line, and its corresponding legend and well map location will highlight automatically.


