PetroView® Popular
Many major oil and gas companies, contractors and financial institutions regard PetroView as the most comprehensive data visualisation package available for the global oil and gas industry.
Mapping software
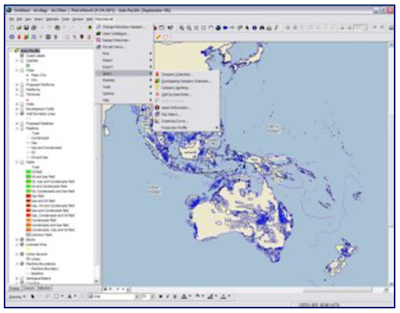
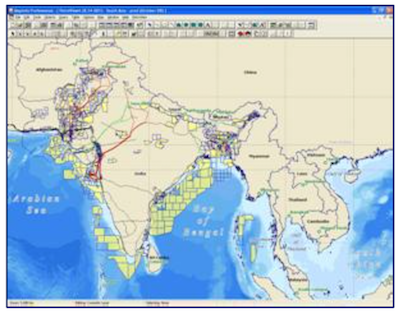
PetroView is a Geographic Information System (GIS), which facilitates spatial analysis of the upstream oil and gas industry. The system brings together data and industry-focused tools in an intuitive manner, enabling both location and attribute data to be analysed simultaneously. A comprehensive database of licences, fields, wells, platforms, pipelines, cultural layers and other infrastructure is presented through a mapping interface.
PetroView is a mature and flexible system that can support a multitude of decision support tasks including business development, new ventures, asset acquisition and asset disposal, economic appraisal, exploration, drafting, presentations, seismic sales and planning.
Data coverage
Detailed upstream oil and gas data is available for the following regions: North West Europe, North Africa and Mediterranean, Sub-Saharan Africa, Asia Pacific, Middle East, South Asia, North Asia, Gulf of Mexico, Alaska, South America, Central America, Eastern Canada, Central and Eastern Europe, Caspian and Russia.
Information is collected on a continuous basis from a variety of sources, including government departments, field operators and other equity partners. Our clients receive monthly updates via internet download.
Accessibility
PetroView extends the power of commercial off-the- shelf GIS packages and is available in desktop and web-based solutions.
Our web-based system, PetroView Live, is built using the ESRI ArcIMS platform. PetroView Live unlocks the data behind PetroView and is designed for use throughout entire organisations.
The simple ‘point and click’ interface can be used by anyone in an organisation regardless of technical ability. The PetroView desktop versions have been built for the standard MapInfo Professional and ESRI ArcGIS environments and offer a rich set of tools and functionality.
Core functionality
The real attraction of the desktop system is the unique combination of regular data updates and industry-specific tools. PetroView employs a consistent data model across all of its datasets making it easy to integrate in-house data and document information.
It also provides users with the ability to quickly and reliably answer complex industry questions using dialog-driven query tools:
Production profile graphs, containing both historical and forecasted oil and gas production, can be generated on a field-by-field basis or aggregated to show a company’s reserves.
Company interest searches reveal the assets associated with a specified company or can be used to compare the portfolio of one company against another. Results can be m


