SURFER
Visualize Data
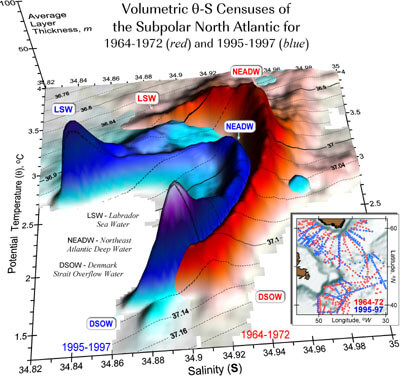
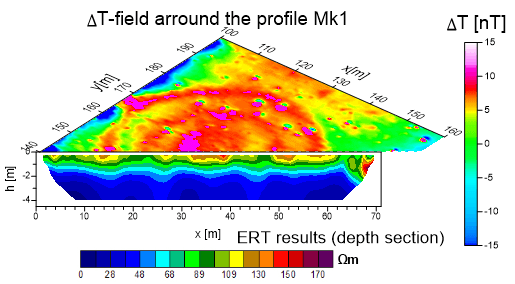
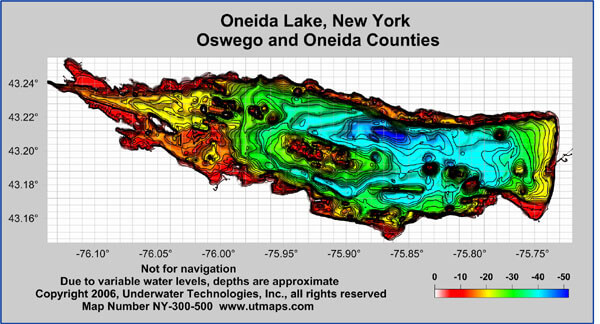
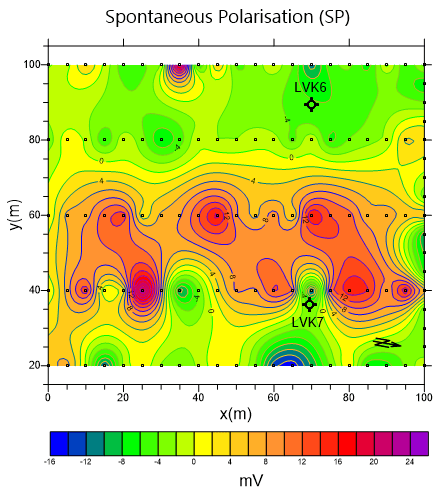
You work hard gathering your data. Don’t settle for subpar visualization. Utilize Surfer’s extensive modeling tools to display your data the way it deserves while maintaining accuracy and precision. Clearly communicate information with Surfer.
Analyze Data
Discover the depths of your data with Surfer’s numerous analysis tools. Adjust interpolation and gridding parameters, assess the spatial continuity of data with variograms, define faults and breaklines, or perform grid calculations such as volumes, transformations, smoothing, or filtering. Surfer quickly transforms your data into knowledge.
Communicate Results
Communicate your hard-earned findings with confidence. Whether it is for your project manager, thesis advisor, or client, Surfer facilitates a complete and thorough understanding of data.
Trusted Since 1983
Surfer has withstood the tests of time. See for yourself why thousands of scientists and engineers across the globe trust Surfer to display their data.
Surfer is actively used in the following industries:
- Agriculture
- Archaeology
- Construction
- Education
- Energy
- Environmental
- Exploration
- Geophysical
- Geotechnical
- Geothermal
- GIS
- Government
- Maritime
- Military
- Mining
- Mudlogging
- Oil & Gas
- Renewable Energy
- UAV / UAS
- Utilities
- Water Resources


