Oil and Gas Viewer Software
There are a number of 3D Viewer in the oil & gas industry which are used to display models in 3D space for better understanding of field and reservoir structure and dynamic behaviour. Recent developments in the field of 3D viewers allow engineers to display complex reservoir structure with use of powerful 3D viewer visualization engines.
NeuraLog - Automated Well Log Digitizing Software
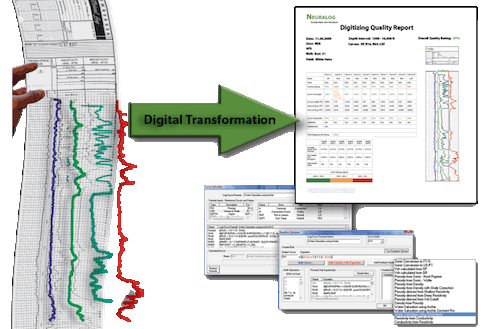
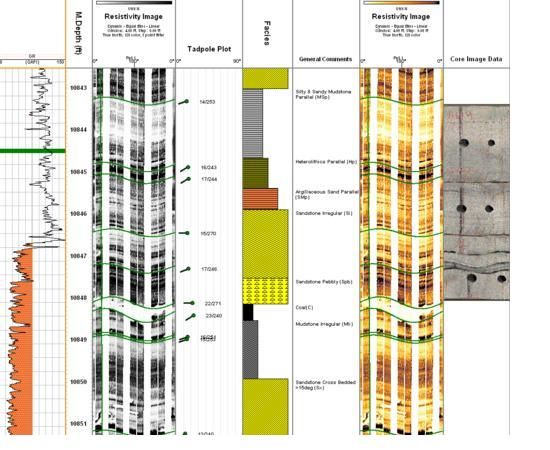
NeuraLog is the most advanced automated well log digitizing system in the world today. NeuraLog transforms scanned paper images into usable computer data. Its reliability and quality improvement increases productivity by empowering the log analyst w ...
Read More ...
NeuraMap - Reservoir Volumetrics and Map Digitizing
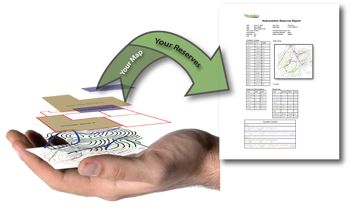
NeuraMap started as a map digitizing solution for geoscientists. This automated map digitizing solution works on hand drawn, scanned map images and digital maps. Map digitizing is a critical component of working with map data for analysis as well ...
Read More ...
NeuraSection - Integrated Geological Evaluation
NeuraSection is the only geological interpretation system available with the image quality to truly support raster and digital well log correlation, cross section creation and analysis. NeuraSection uses your existing log images and digital files and ...
Read More ...
NeuraView - Document Viewing, Editing & Printing
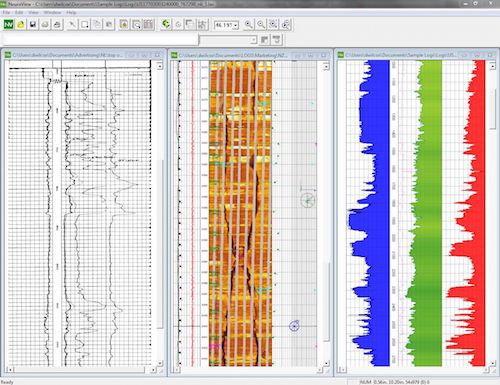
NeuraView is the solution to display, edit, process, annotate and print large documents. NeuraView will read any standard TIFF, JPG, BMP, PDS, PDF, CGM, EMF and LAS image (color, greyscale, or B&W) and will display that image in the view wind ...
Read More ...
AutoDidge is designed to partially automate the process of converting raster images of logs into digital vector representations of the curves. Digitized logs are required for software to perform any meaningful correction or analysis on them.
AutoDidge uses TIFF or BMP formatted images of paper logs ...
Read More ...
PetroView® Popular
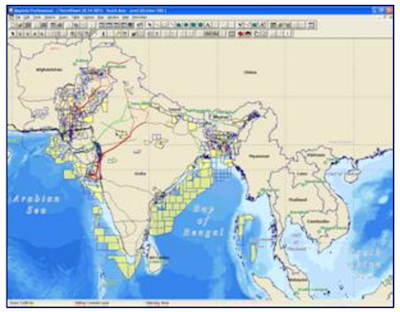
Many major oil and gas companies, contractors and financial institutions regard PetroView as the most comprehensive data visualisation package available for the global oil and gas industry.
Mapping software
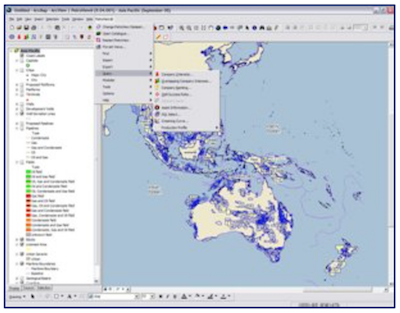
PetroView is a Geographic Information System (GIS), which facilitates spatial analysis of t ...
Read More ...
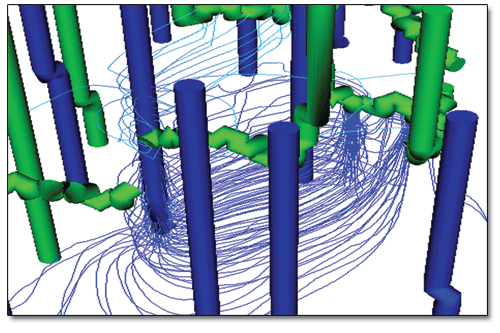
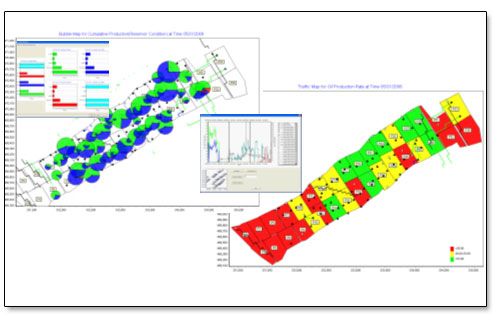
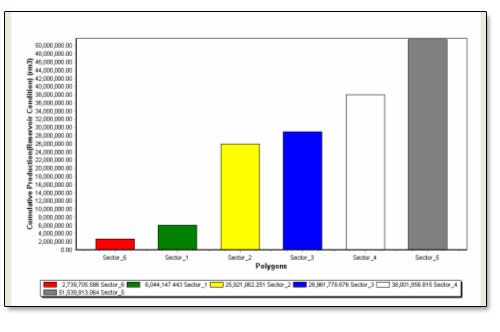
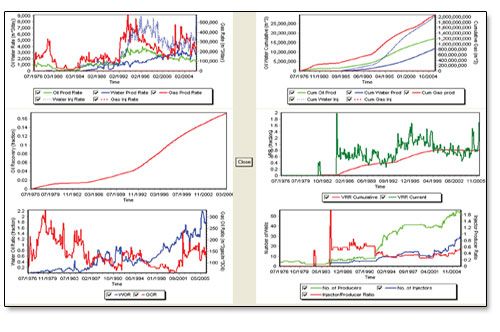
CAESAR is a well and reservoir management software that combines the power of reservoir simulation results with the analytics of production data. It offers powerful visualization view along with the capability to generate reports. The engineers can have a 3D scan of the reservoir along with the capa ...
Read More ...
Visualize Data
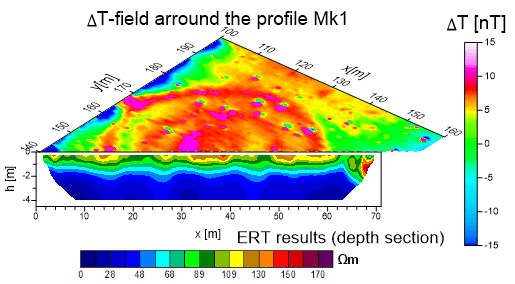
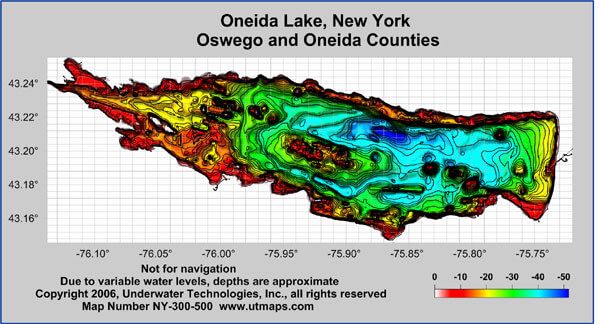
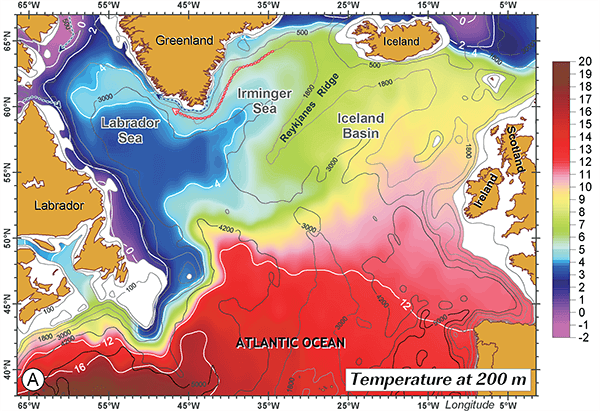
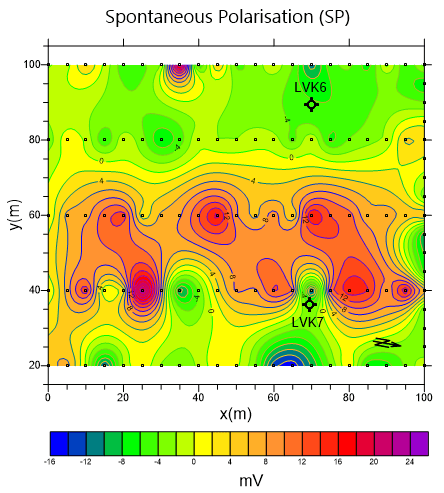
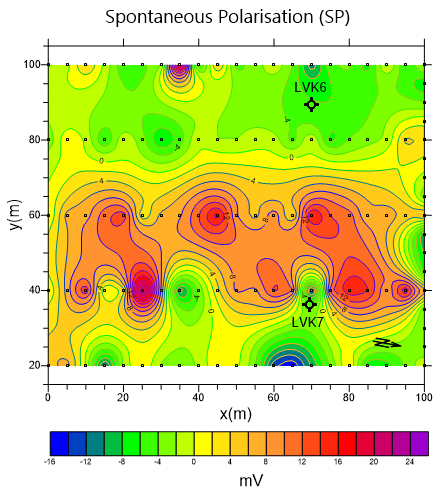
You work hard gathering your data. Don’t settle for subpar visualization. Utilize Surfer’s extensive modeling tools to display your data the way it deserves while maintaining accuracy and precision. Clearly communicate information with Surfer.
Analyze Data
Discover the depths of yo ...
Read More ...
Visualize Data
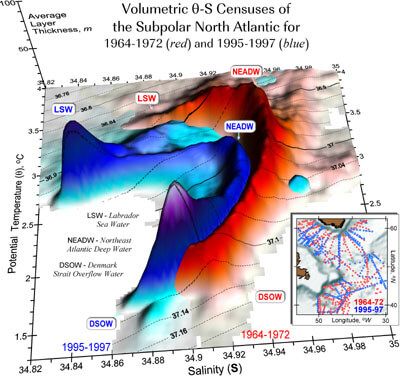
Present your data at its best. Grapher offers high-quality graphing tools so you can get the most out of your data. Grapher provides over 70 different 2D and 3D graphing options to best display your data.
Analyze Data
Don’t miss any opportunity. Your data may be hiding valuable inf ...
Read More ...
Visualize Data
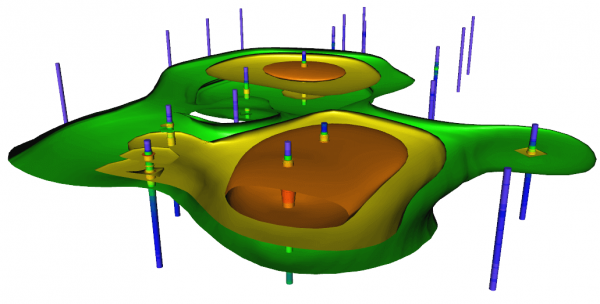
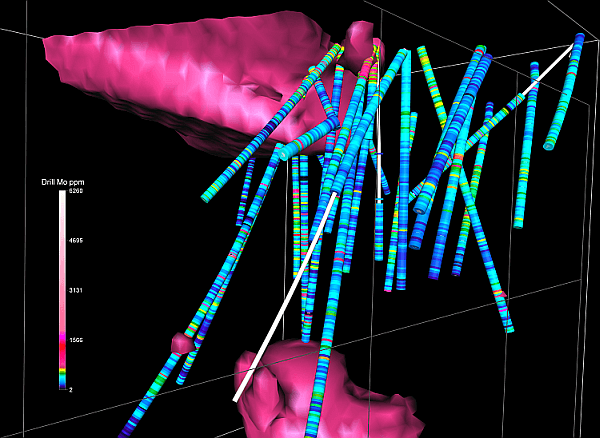
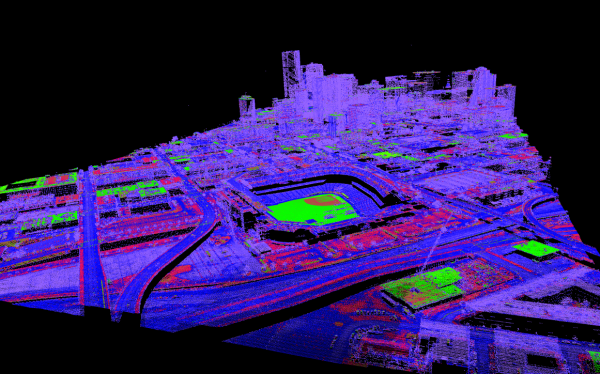
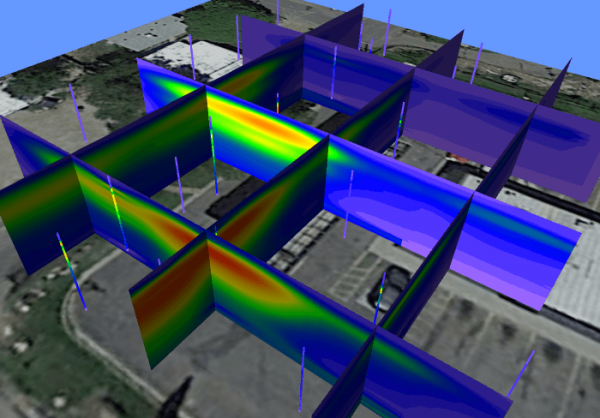
Model data with striking clarity in every dimension. With Voxler’s extensive 3D modeling tools, it is easy to visualize multi-component data for geologic and geophysical models, contamination plumes, LiDAR point cloud, borehole models, or ore body deposit models. Distinguish areas of ...
Read More ...

